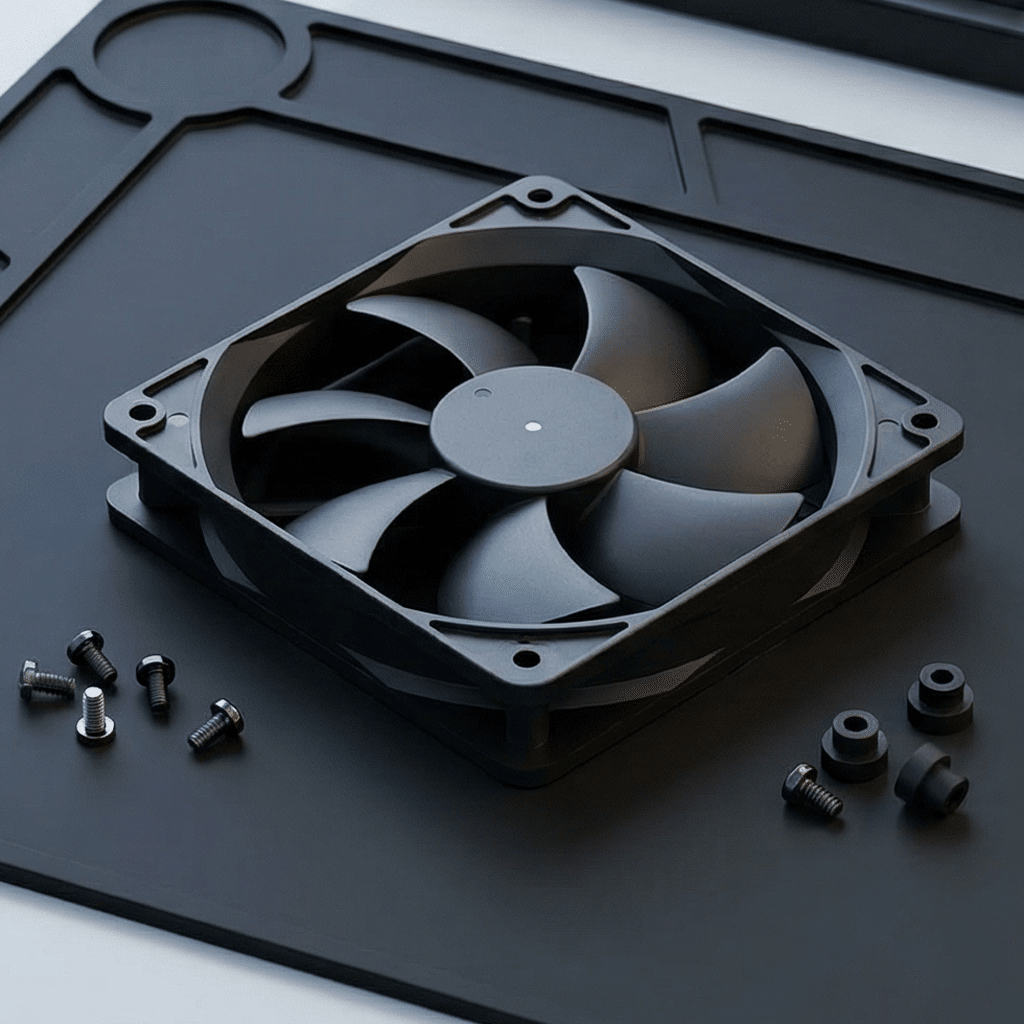
Cooling Fan Sample Testing Specifications: How to Scientifically Verify Performance
Cooling Fan Sample Testing Specifications: How to Scientifically Verify Performance
A comprehensive guide to scientifically testing cooling fan samples—from airflow, pressure, and noise to environmental reliability and compliance with international standards
Cooling fans are critical components in electronic systems—from servers and telecommunications equipment to automotive electronics and medical devices. The accuracy of fan performance test data directly impacts design success, system reliability, and product lifecycle costs [citation:1]. Yet until recently, the industry lacked standardized testing methods, with manufacturers using proprietary approaches that made comparison and validation difficult [citation:1].
The Need for Standardized Testing
In 2023, the China Power Supply Society published T/CPSS 1003—2023 "DC Cooling Fan General Performance Test Specification"—a landmark standard developed by leading companies including航嘉驰源,瓦特源检测研究, and China Quality Certification Centre [citation:1]. This standard unified testing methodologies for parameters including input voltage, current, starting characteristics, speed control, noise, and RD signals, providing engineers with reliable, comparable data for the first time [citation:1][citation:3].
This guide synthesizes these standardized approaches with international best practices to help engineers, procurement professionals, and quality managers scientifically verify cooling fan sample performance.
01 Core Performance Parameters: What to Measure
Scientific fan testing begins with understanding the complete parameter set that defines fan performance. Modern test specifications cover electrical, mechanical, and acoustic characteristics [citation:1][citation:2].
Primary Test Parameters
| Parameter | Description | Typical Units | Test Method |
|---|---|---|---|
| Airflow | Volume of air moved per unit time | CFM (ft³/min) or m³/h | Wind tunnel or airflow bench measurement [citation:2] |
| Static Pressure | Pressure generated to overcome system resistance | mmH₂O, Pa, or inch-H₂O | Pressure transducer in sealed chamber [citation:2] |
| P-Q Curve | Complete pressure-flow relationship across operating range | Graph (Pa vs. CFM) | Multi-point measurement with variable restriction [citation:4] |
| Rotational Speed | Fan RPM under specified conditions | RPM | Non-contact tachometer or Hall sensor [citation:2] |
| Noise Level | Sound pressure at defined distance and operating point | dBA | Anechoic chamber with sound level meter [citation:2] |
| Power Consumption | Electrical input power at rated voltage | W | Power analyzer measuring V, I, and PF [citation:4] |
| Current | Operating and starting current | A | Current probe or shunt measurement [citation:1] |
Electrical and Control Parameters
Start-Up Characteristics
- Start-up voltage: Minimum voltage for reliable start
- Start-up current: Peak inrush current during start
- Start-up time: Time to reach stable speed [citation:1]
PWM Control
- Duty cycle range: Minimum to maximum controllable speed
- Frequency response: Speed variation with PWM frequency
- Linearity: Speed vs. duty cycle correlation [citation:1]
Protection Features
- Locked rotor current: Current with rotor stalled
- Reverse polarity protection: Behavior with reversed supply
- RD signal: Rotation detection output characteristics [citation:1]
Standardized test specifications require that each parameter be measured under defined conditions—including specified temperature, humidity, and mounting orientation—to ensure reproducibility and comparability across different samples and laboratories [citation:1].
02 Test Equipment and Instrumentation
Accurate measurement requires properly calibrated instruments with appropriate ranges and resolutions [citation:2].
Essential Test Equipment
| Instrument | Measured Parameters | Specifications |
|---|---|---|
| Wind Tunnel / Airflow Bench | Airflow, static pressure, P-Q curve | Compliant with AMCA 210 or ISO 5801 [citation:4] |
| Power Analyzer | Voltage, current, power, power factor | 0.1% accuracy, high bandwidth for inrush capture [citation:4] |
| Sound Level Meter | Noise level, frequency spectrum | Type 1 or 2 per IEC 61672, anechoic environment [citation:2] |
| Non-Contact Tachometer | Rotational speed | Laser or reflective type, ±1 RPM accuracy [citation:2] |
| Oscilloscope | Waveform analysis, start-up transients | 100 MHz+ bandwidth for PWM and commutation analysis |
| Temperature Chamber | Environmental testing | -40°C to +100°C range, humidity control [citation:7] |
| Vibration Test System | Mechanical reliability | Sine/random vibration per ISO and IEC standards [citation:5] |
Sample Requirements
- Standard testing: Minimum 3-5 samples for non-destructive tests [citation:9]
- Destructive/durability testing: 8-12 samples for life cycle assessment [citation:9]
- Material/component analysis: 5+ samples for destructive evaluation [citation:9]
- All samples: Should be randomly selected from production batches to represent typical quality
03 Test Methods and Procedures
Airflow and Static Pressure Measurement
The complete pressure-flow (P-Q) curve is fundamental to fan performance characterization. Per T/CPSS 1003-2023, the test procedure includes [citation:1]:
- Mount fan to test chamber with standardized inlet/outlet configurations
- Measure airflow at multiple back-pressure points from free delivery (zero pressure) to shut-off (zero flow) [citation:4]
- Record at least 10-15 points to accurately define the curve
- For miniature fans, specialized micro-wind tunnels with Pitot tubes measure dynamic pressure at multiple cross-section points [citation:10]
Noise Testing Protocol
- Perform in anechoic or semi-anechoic chamber with background noise at least 10 dBA below measurement [citation:2]
- Position microphone at specified distance (typically 1m) and orientation (usually intake side at 45°)
- Measure at rated voltage and multiple speed points
- Record both overall dBA and frequency spectrum to identify tonal components [citation:4]
Power and Efficiency Measurement
- Use precision power analyzer to measure voltage, current, and power factor [citation:4]
- Calculate efficiency as: (Air power output) / (Electrical power input) × 100%
- Air power = Static pressure × Airflow (with appropriate unit conversions)
- Test across operating range to identify peak efficiency point [citation:4]
Environmental and Reliability Testing
Per T/CPSS 1002-2023 "DC Cooling Fan Environmental Adaptability Test Specification," comprehensive reliability testing includes [citation:7]:
Temperature Tests
- Low temperature storage/operation
- High temperature operation
- Temperature cycling
- Thermal shock
- High temperature start/stop cycling [citation:7]
Humidity Tests
- Damp heat steady state
- Temperature/humidity cycling
- High humidity storage
- Condensation resistance [citation:7]
Mechanical Tests
- Random vibration
- Sine vibration
- Mechanical shock
- Packaging drop test
- Transport vibration [citation:7]
Additional tests: Salt spray (corrosion resistance), dust ingress (IP rating verification), and insulation resistance measurement before/after environmental exposure [citation:5][citation:7].
Lifetime Testing
T/CPSS 1011-2024 "DC Cooling Fan Operating Life Test Method" specifies [citation:2]:
- Test conditions: Rated voltage, maximum ambient temperature (typically 70°C), continuous operation
- Sample size: Minimum 11 units for statistical validity
- Monitoring: Periodic measurement of speed, current, and noise
- Failure criteria: Speed drop >15%, current change >20%, or abnormal noise
- Test duration: Typically 2,000-10,000 hours with extrapolation to rated life (L10 at 70,000 hours)
04 Test Execution: Step-by-Step Process
Standard Sample Test Workflow
Step 1: Sample Preparation and Identification
- Receive and log samples with unique IDs
- Verify sample condition and documentation
- Pre-condition at room temperature for 2 hours [citation:2]
Step 2: Visual and Mechanical Inspection
- Check dimensions, mounting features, labeling
- Inspect for defects, damage, or contamination
- Measure mass and verify against specification
Step 3: Electrical Parameter Measurement
- Measure start-up voltage and current [citation:1]
- Record operating current and power at rated voltage
- Verify PWM control range and linearity [citation:1]
- Test protection features (locked rotor, reverse polarity) [citation:1]
Step 4: Aerodynamic Performance Testing
- Mount fan on airflow test bench per standard configuration [citation:2]
- Measure complete P-Q curve at rated voltage
- Record at 10-15 points from free air to shut-off
- Measure at multiple speed points (if speed controllable) [citation:4]
Step 5: Acoustic Testing
- Place in anechoic chamber, allow stabilization
- Measure noise at rated voltage and specified distance [citation:2]
- Record both dBA and frequency spectrum
- Repeat at minimum and maximum speed points
Step 6: Environmental Testing (Selected Samples)
- Subject samples to specified temperature, humidity, or vibration profiles [citation:7]
- Re-measure key parameters after exposure
- Compare pre/post test performance
Step 7: Data Analysis and Reporting
- Compile all measurements into standardized format
- Generate P-Q curves and performance plots
- Compare against specification and acceptance criteria
- Issue test report with full documentation [citation:2]
Testing laboratories typically complete standard test sequences within 7-15 working days, with complex environmental or destructive testing requiring 15-25 days [citation:2][citation:9].
05 Interpreting Test Results: What the Data Tells You
P-Q Curve Analysis
- Operating point: Intersection of fan P-Q curve with system impedance curve determines actual airflow in application
- Curve shape: Steep curve indicates high-pressure capability; flat curve indicates high-flow design
- Consistency: Compare multiple samples—variation should be within ±5% for quality products
Efficiency Evaluation
- Peak efficiency typically occurs at 60-80% of maximum flow
- High-quality EC fans achieve >50% peak efficiency [citation:4]
- Low efficiency indicates poor aerodynamic or motor design
Noise Signature Analysis
- Broadband noise: Caused by turbulence—acceptable if within limits
- Tonal peaks: Discrete frequencies from blade passing or motor commutation—often objectionable even if overall dBA is low
- Abnormal sounds: Clicking, rattling, or bearing noise indicates quality issues
Pass/Fail Criteria (per T/CPSS 1003-2023)
| Parameter | Acceptance Criteria |
|---|---|
| Airflow at rated point | Within ±10% of specification [citation:1] |
| Static pressure at rated point | Within ±10% of specification [citation:1] |
| Current consumption | Within ±15% of specification |
| Speed (RPM) | Within ±10% at rated voltage |
| Noise level | Within specified dBA + tolerance (typically +3 dBA max) [citation:1] |
| Start-up voltage | Must start reliably at specified minimum voltage |
06 International Standards and Compliance
Key Testing Standards
| Standard | Scope | Region/Application |
|---|---|---|
| T/CPSS 1003-2023 | DC cooling fan general performance test [citation:1] | China, comprehensive electrical/mechanical/acoustic testing |
| T/CPSS 1002-2023 | DC cooling fan environmental adaptability [citation:7] | China, temperature/humidity/vibration/salt spray testing |
| T/CPSS 1011-2024 | DC cooling fan operating life test [citation:2] | China, lifetime and reliability assessment |
| NB/T 10457-2020 | AC-DC power supply fan airflow/pressure test [citation:2] | China, power supply applications |
| ISO 5801 | Industrial fan performance testing [citation:9] | International, general fan testing |
| AMCA 210 | Laboratory methods for fan aerodynamic rating [citation:4] | North America, airflow measurement |
| IEC 60335-2-80 | Safety of fans for household and similar purposes [citation:6] | International, safety testing |
Regulatory Compliance Testing
For market access, additional compliance testing may be required [citation:6]:
- CE marking (Europe): LVD (safety) per EN 60335, EMC per EN 55014 series [citation:6]
- UL certification (North America): UL 507 for fans, UL 60950 for IT equipment integration
- CCC marking (China): GB standards for safety and EMC
- ErP Directive (Europe): Energy efficiency requirements for EC fans [citation:6]
07 Common Testing Pitfalls and How to Avoid Them
Improper Mounting
Fan performance is affected by inlet/outlet obstructions. Always use standardized mounting plates per test specifications [citation:1].
Insufficient Warm-Up
Bearings and electronics require stabilization time. Allow 5-10 minutes warm-up before recording data.
Single-Point Testing Only
The full P-Q curve is essential—single-point measurements miss performance characteristics at other operating conditions [citation:4].
Ignoring Environmental Factors
Temperature and humidity affect airflow and noise. Control and report environmental conditions during all tests [citation:7].
Inadequate Sample Size
Single-sample testing cannot reveal production variation. Test multiple samples for statistical validity [citation:9].
Uncalibrated Instruments
All test equipment must have current calibration certificates traceable to national standards.
Conclusion: Building a Scientific Testing Framework
Cooling fan performance verification has evolved from proprietary, inconsistent methods to standardized, scientifically rigorous testing. The T/CPSS 1000 series of standards represents a major step forward, providing engineers with reliable, comparable data for design validation and quality assurance [citation:1][citation:7].
For organizations implementing fan sample testing, the key principles are:
- Standardize: Follow recognized test specifications (T/CPSS, ISO, AMCA) for reproducible results
- Comprehensive: Test all relevant parameters—electrical, aerodynamic, acoustic, and environmental
- Statistical: Use adequate sample sizes to understand production variation
- Documented: Maintain complete records of test conditions, equipment, and results
- Applied: Use test data to improve designs, qualify suppliers, and ensure system reliability
Key Parameters Summary Table
| Category | Key Parameters | Typical Acceptance |
|---|---|---|
| Aerodynamic | Airflow, static pressure, P-Q curve | ±10% of spec at rated point |
| Electrical | Current, power, start-up voltage | ±15% of spec |
| Acoustic | Noise level, frequency spectrum | Spec +3 dBA max |
| Control | PWM range, linearity, RD signal | Per specification |
| Environmental | Temperature, humidity, vibration | No failure post-test |
By implementing these scientific testing methodologies, engineers can confidently select fans that will perform reliably in their applications, reducing field failures and optimizing thermal management performance.
2026 Fan Sourcing Guide: From AC to DC – Key OEM/ODM Considerations for Global Buyers
The Cooling Fan Energy Efficiency Revolution: The Era of EC Fans Fully Replacing AC Has Arrived
Related Article